User Dashboard
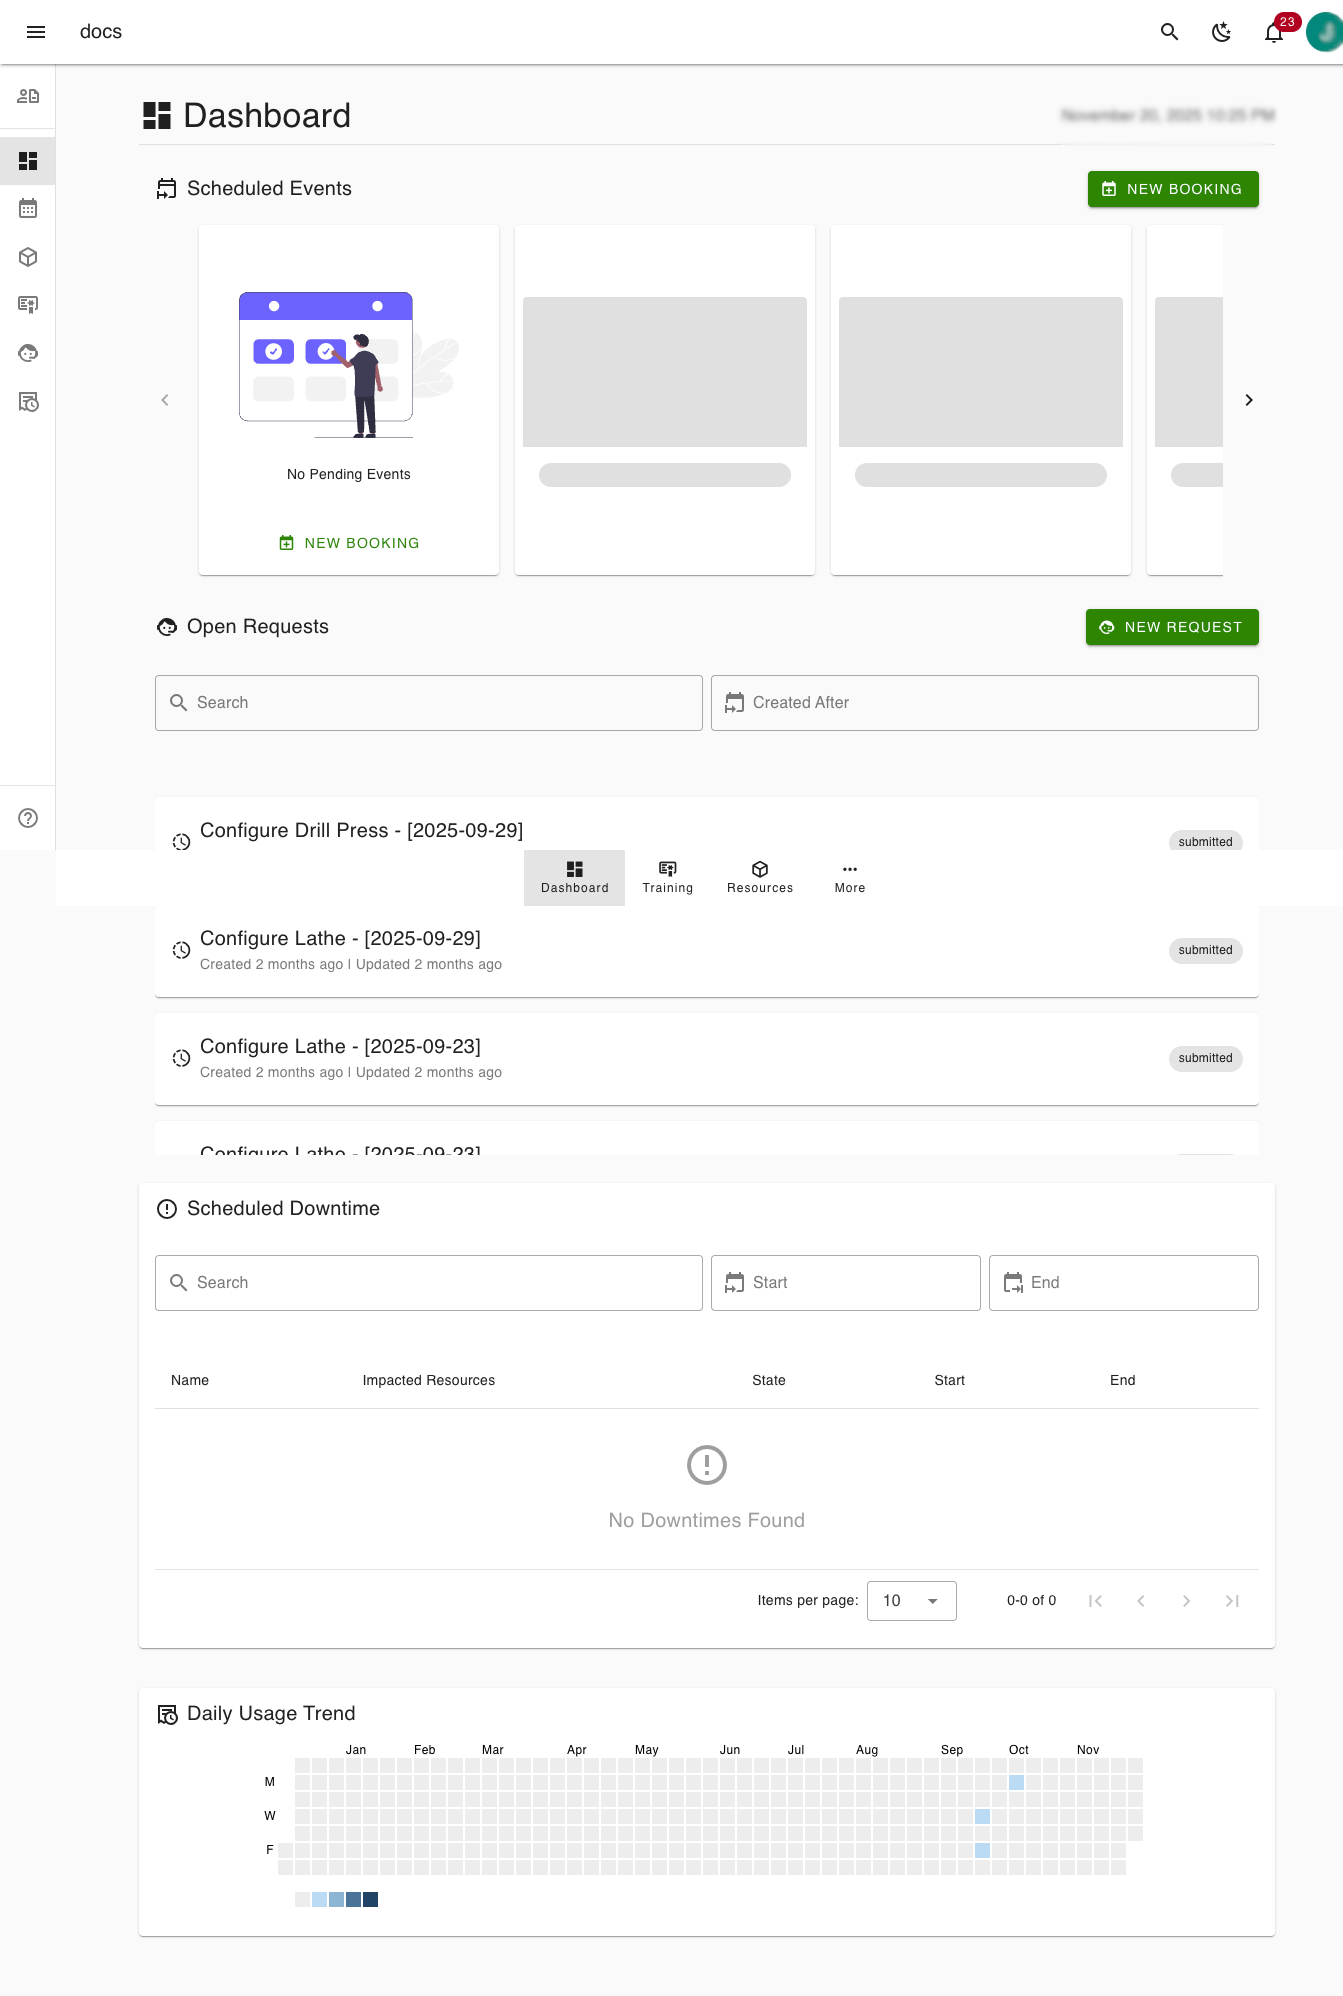
The User Dashboard is the main landing page you’ll see after signing in. It gives you a clear, at-a-glance view of what’s coming up, what needs your attention, and how you’ve been using shared resources.
Think of the dashboard as your daily control panel for Colabmacs.
What You’ll See at a Glance
From the dashboard, you can quickly:
- View upcoming bookings and events
- Track the status of your requests
- See scheduled resource downtime
- Review your recent usage activity
- Jump directly to common actions like booking resources or submitting requests
Scheduled Events
Located at the top of the dashboard, the Scheduled Events section shows what you have coming up.
What It Shows
- A carousel of upcoming bookings and scheduled events
- Navigation arrows (< and >) to move through events
- A message such as “No Pending Events” if nothing is scheduled
Quick Actions
- Click an event card to view details
- Click NEW BOOKING to create a new reservation
(See: Booking Resources for more)
This section helps you quickly answer: “What am I scheduled to use next?”
Open Requests
Below scheduled events, the Open Requests section keeps track of items you’ve submitted that are still in progress.
What It Shows
- A list of your active requests
- The current request status (for example, submitted)
- Created and last-updated timestamps
Filters & Search
- Search requests by name
- Filter by creation date using Created After
Quick Actions
- Click a request to view its details
- Click NEW REQUEST to submit a new one
(Learn more: Requests)
This section helps you stay informed without needing to check each request individually.
Scheduled Downtime
The Scheduled Downtime section shows upcoming maintenance or downtime that may affect resources you use.
What It Shows
- Planned downtime events
- Which resources are impacted
- Start and end times
Table Overview
| Column | Description |
|---|---|
| Name | Downtime or maintenance name |
| Impacted Resources | Resources affected |
| State | Current downtime status |
| Start | Start date and time |
| End | End date and time |
If no downtime is scheduled, you’ll see “No Downtimes Found”.
This helps you avoid booking resources that will be unavailable.
Daily Usage Trend
At the bottom of the dashboard, the Daily Usage Trend provides a visual overview of how often you’ve used resources over time.
How to Read It
- Each square represents a day
- Darker colors indicate higher usage
- Lighter colors indicate lower or no usage
- The calendar view spans multiple months
Why It’s Useful
- Spot usage patterns at a glance
- Identify busy and quiet periods
- Plan future bookings more effectively
This data reflects your activity across resources.
Navigation Overview
Sidebar Menu
The sidebar provides quick access to key areas of Colabmacs:
- Dashboard — Your main overview
- Training — View and manage required training
- Resources — Browse and search available resources
- More — Access additional features and tools
Top Bar
Across the top of the application, you’ll find:
- Menu toggle (☰) to expand or collapse the sidebar
- Application name
- Global search
- Theme toggle (light/dark mode)
- Notifications (bell icon)
- User avatar for profile and account options
Next Steps
From the dashboard, most users continue to:
- Browse and favorite resources
- Complete required training
- Submit or track requests
- Book time on approved resources
The dashboard is designed to surface what matters most, so you can spend less time navigating and more time getting work done.